除了基于 CPU 和内存来进行自动扩缩容之外,有些业务需要基于自定义指标进行HPA弹性伸缩,通用做法是结合prometheus能力。
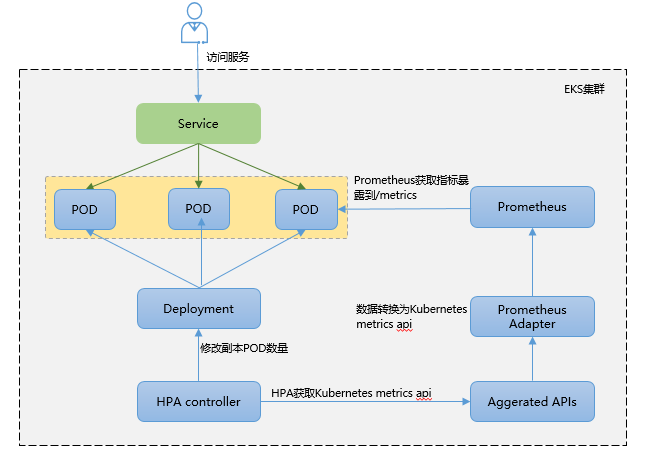
如上图示,基于自定义指标进行HPA弹性的核心原理为:
- 业务能够暴露指标,注意是prometheus格式的指标,即能被prometheus识别,一般是暴露到prometheus的
/metrics下。
- Kubernetes并不能识别Prometheus格式指标,所以这时需要通过Prometheus Adapter将其进行转换,转换为Kubernetes metrics API.
- Kubernetes的HPA控制器通过Kubernetes metrics API识别到业务指标变化,根据HPA策略来发起POD的弹性伸缩。
1. 准备工作
2. 验证步骤
1)基于自定义指标进行HPA弹性伸缩,首先需要业务侧暴露自己的指标;
2)在prometheus中查阅到业务自定义指标,基于指标定义HPA策略
3)模拟增加业务流量触发HPA策略
2.1 业务自定义指标
准备一个简单的go web 应用,能够记录请求次数并经过 /metrics 端点输出 Prometheus 格式的指标 http_requests_total。
main.go代码如下:
 1
 2
 3
 4
 5
 6
 7
 8
 9
10
11
12
13
14
15
16
17
18
19
20
21
22
23
24
25
26
27
28
29
30
31
32
33
|
package main

import (
        "github.com/prometheus/client_golang/prometheus"
        "github.com/prometheus/client_golang/prometheus/promhttp"
        "net/http"
        "strconv"
)

func main() {
        metrics := prometheus.NewCounterVec(
                prometheus.CounterOpts{
                        Name:        "http_requests_total",
                        Help:        "Number of total http requests",
                },
                []string{"status"},
        )
        prometheus.MustRegister(metrics)

        http.HandleFunc("/", func(w http.ResponseWriter, r *http.Request) {
                path := r.URL.Path
                statusCode := 200
                switch path {
                case "/metrics":
                        promhttp.Handler().ServeHTTP(w, r)
                default:
                        w.WriteHeader(statusCode)
                        w.Write([]byte("Hello World!\n"))
                }
                metrics.WithLabelValues(strconv.Itoa(statusCode)).Inc()
        })
        http.ListenAndServe(":3000", nil)
}
|
将应用打包成镜像。
 1
 2
 3
 4
 5
 6
 7
 8
 9
10
11
12
13
14
15
16
17
18
19
20
21
22
|
FROM golang:1.17-alpine as builder

WORKDIR /workspace

COPY go.mod .
COPY go.sum .

RUN go env -w GO111MODULE=on
RUN go env -w GOPROXY=http://xxx.xxx.xxx.com/goproxy/
RUN go env -w GONOSUMDB=*

RUN go mod download

COPY . .
RUN go build -o /out/httpserver .

FROM alpine:3.12

COPY --from=builder /out/httpserver /app/httpserver

EXPOSE 3000
ENTRYPOINT ["/app/httpserver"]
|
通过Dockerfile将业务打包成镜像。
 1
 2
 3
 4
 5
 6
 7
 8
 9
10
11
12
13
14
15
16
17
18
19
20
21
22
23
24
25
26
27
28
29
30
31
32
33
34
35
36
37
38
39
40
41
42
43
44
45
46
47
48
49
|
➜  docker build . -t go_hpa_test_:v1.0
Sending build context to Docker daemon  330.5MB
Step 1/14 : FROM golang:1.17-alpine as builder
 ---> d8bf44a3f6b4
Step 2/14 : WORKDIR /workspace
 ---> Using cache
 ---> aa4724347b00
Step 3/14 : COPY go.mod .
 ---> Using cache
 ---> fba2a0df8d07
Step 4/14 : COPY go.sum .
 ---> Using cache
 ---> 97f38bc17bba
Step 5/14 : RUN go env -w GO111MODULE=on
 ---> Running in be2663fc36da
Removing intermediate container be2663fc36da
 ---> 95280728aa87
Step 6/14 : RUN go env -w GOPROXY=http://xxx.xxx.xxx.com/goproxy/
 ---> Running in 4e5b01768775
Removing intermediate container 4e5b01768775
 ---> 10d61346ee92
Step 7/14 : RUN go env -w GONOSUMDB=*
 ---> Running in f35b7aa9c7e4
Removing intermediate container f35b7aa9c7e4
 ---> 278f85c1206e
Step 8/14 : RUN go mod download
 ---> Running in 4dd31a66aa4b
Removing intermediate container 4dd31a66aa4b
 ---> 973554f40b46
Step 9/14 : COPY . .
 ---> 369a6973ab07
Step 10/14 : RUN go build -o /out/httpserver .
 ---> Running in 9f77356a0c55
Removing intermediate container 9f77356a0c55
 ---> a367baf79a62
Step 11/14 : FROM alpine:3.12
 ---> b0925e081921
Step 12/14 : COPY --from=builder /out/httpserver /app/httpserver
 ---> 38c8af1e9c72
Step 13/14 : EXPOSE 3000
 ---> Running in 11986e605c45
Removing intermediate container 11986e605c45
 ---> 0a48b326db28
Step 14/14 : ENTRYPOINT ["/app/httpserver"]
 ---> Running in cde4621aa699
Removing intermediate container cde4621aa699
 ---> 84fc14c9f6c1
Successfully built 84fc14c9f6c1
Successfully tagged hpa_test_img:v1.0
|
需要注意的是,在内网无法拉取golang:1.17-alpine和alpine:3.12镜像,可以先在可联网的设备上下载好镜像在load加载进来。
上面的Dockerfiler会生成go_hpa_test:v1.0镜像,可以将镜像push到ECR镜像私有仓,方便后续从Kubernetes中创建Deployment,在各个节点生成POD。
1
2
3
|
➜  docker login -u m00602320 xxx.xxx.xxx.com:80  #输入账号密码
➜  docker tag go_hpa_test:v1.0 xxx.xxx.xxx.com:80/repo-mxh/go_hpa_test:v1.0
➜  docker push xxx.xxx.xxx.com:80/repo-mxh/go_hpa_test:v1.0
|
创建Deployment,sample-httpserver-deployment.yaml:
 1
 2
 3
 4
 5
 6
 7
 8
 9
10
11
12
13
14
15
16
17
18
19
20
21
22
23
24
25
26
27
28
29
30
31
32
|
apiVersion: apps/v1
kind: Deployment
metadata:
  labels:
    app: sample-httpserver
  name: sample-httpserver
  namespace: default
spec:
  replicas: 1
  selector:
    matchLabels:
      app: sample-httpserver
  strategy: {}
  template:
    metadata:
      annotations:
        prometheus.io/scrape: "true"
        prometheus.io/path: /metrics
        prometheus.io/port: "3000"
      labels:
        app: sample-httpserver
    spec:
      imagePullSecrets:
        - name: myregcred
      containers:
        - image: xxx.xxx.xxx.com:80/repo-mxh/go_hpa_test:v1.0
          name: httpserver-n-metrics
          ports:
            - containerPort: 3000
          resources:
            requests:
              memory: '300Mi'
|
apply生成负载:
 1
 2
 3
 4
 5
 6
 7
 8
 9
10
|
➜  kubectl apply -f sample-httpserver-deployment.yaml
deployment.apps/sample-httpserver created

➜  kubectl get deployment
NAME                READY   UP-TO-DATE   AVAILABLE   AGE
sample-httpserver   1/1     1            1           8s

➜  kubectl get po
NAME                                 READY   STATUS    RESTARTS   AGE
sample-httpserver-6784dcf77c-56th4   1/1     Running   0          14s
|
sample-service.yaml:
 1
 2
 3
 4
 5
 6
 7
 8
 9
10
11
12
13
14
15
|
apiVersion: v1
kind: Service
metadata:
  name: http-sample-svc
  labels:
    app: http-sample-svc
spec:
  ports:
  - port: 8080
    targetPort: 3000  # pod port 与上面3000保持一致
    protocol: TCP
    name: http
  type: NodePort
  selector:
    app: sample-httpserver  #这里与上面的pod的labels要一致
|
apply生成service:
1
2
3
4
5
6
|
➜ kubectl get svc -o wide
NAME TYPE CLUSTER-IP EXTERNAL-IP PORT(S) AGE SELECTOR
http-sample-svc NodePort 12.12.126.83 <none> 8080:30826/TCP 9s app=sample-httpserver
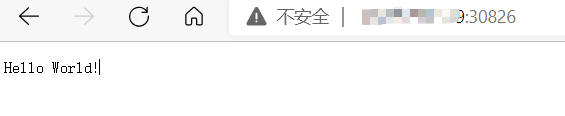
➜ curl http://12.12.126.83:8080 #在集群节点上访问上面的应用服务
Hello World!
|
因为服务的类型设置为NodePort了,所以我们在集群外部也可以通过NodeIP:NodePort来访问:
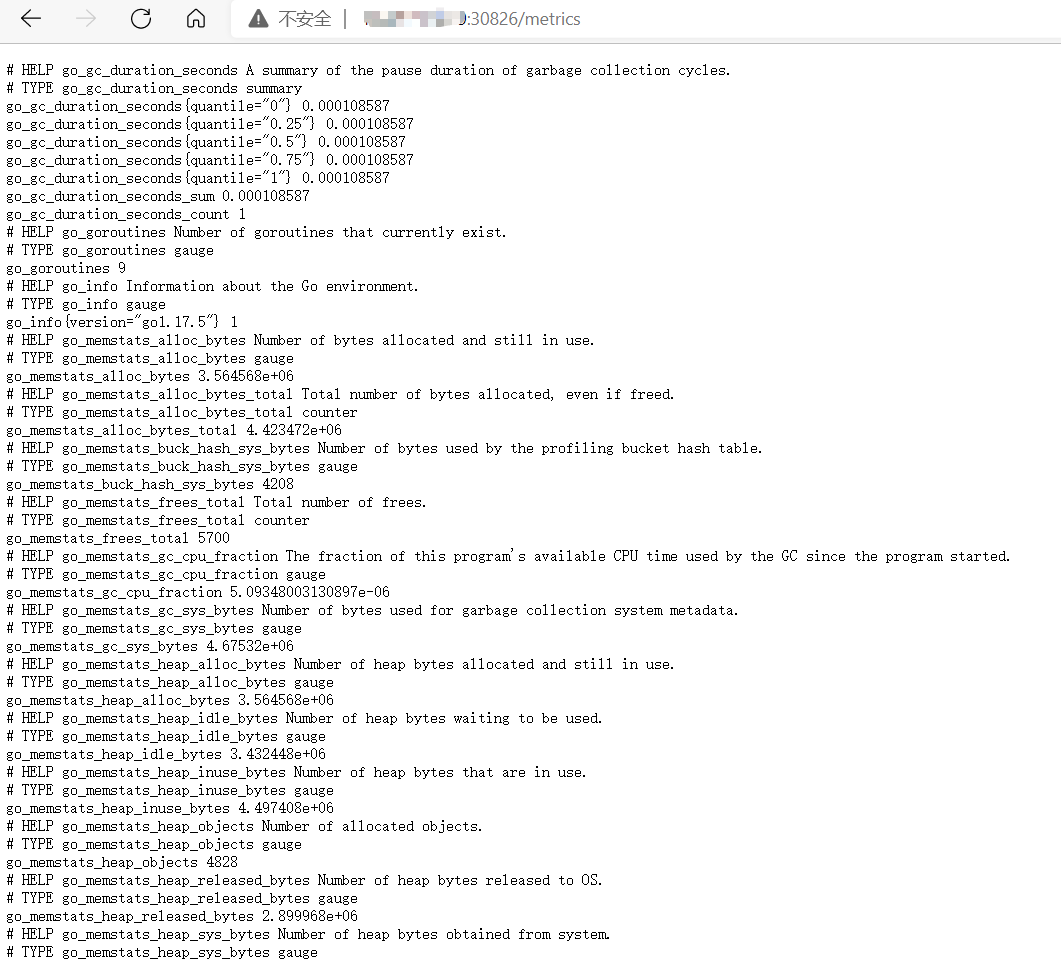
通过/metrics来查看业务指标:
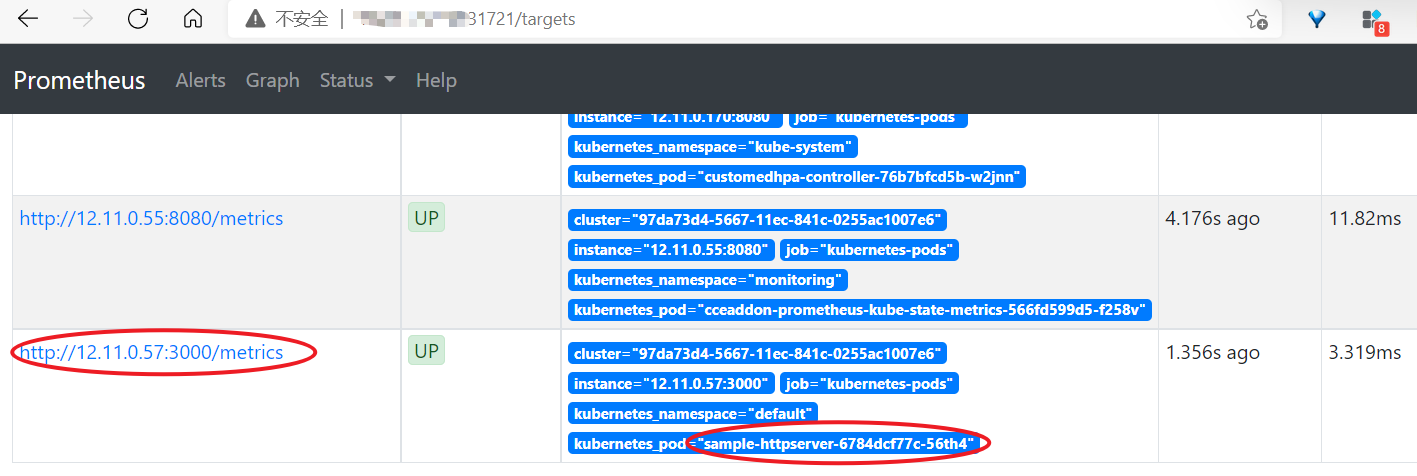
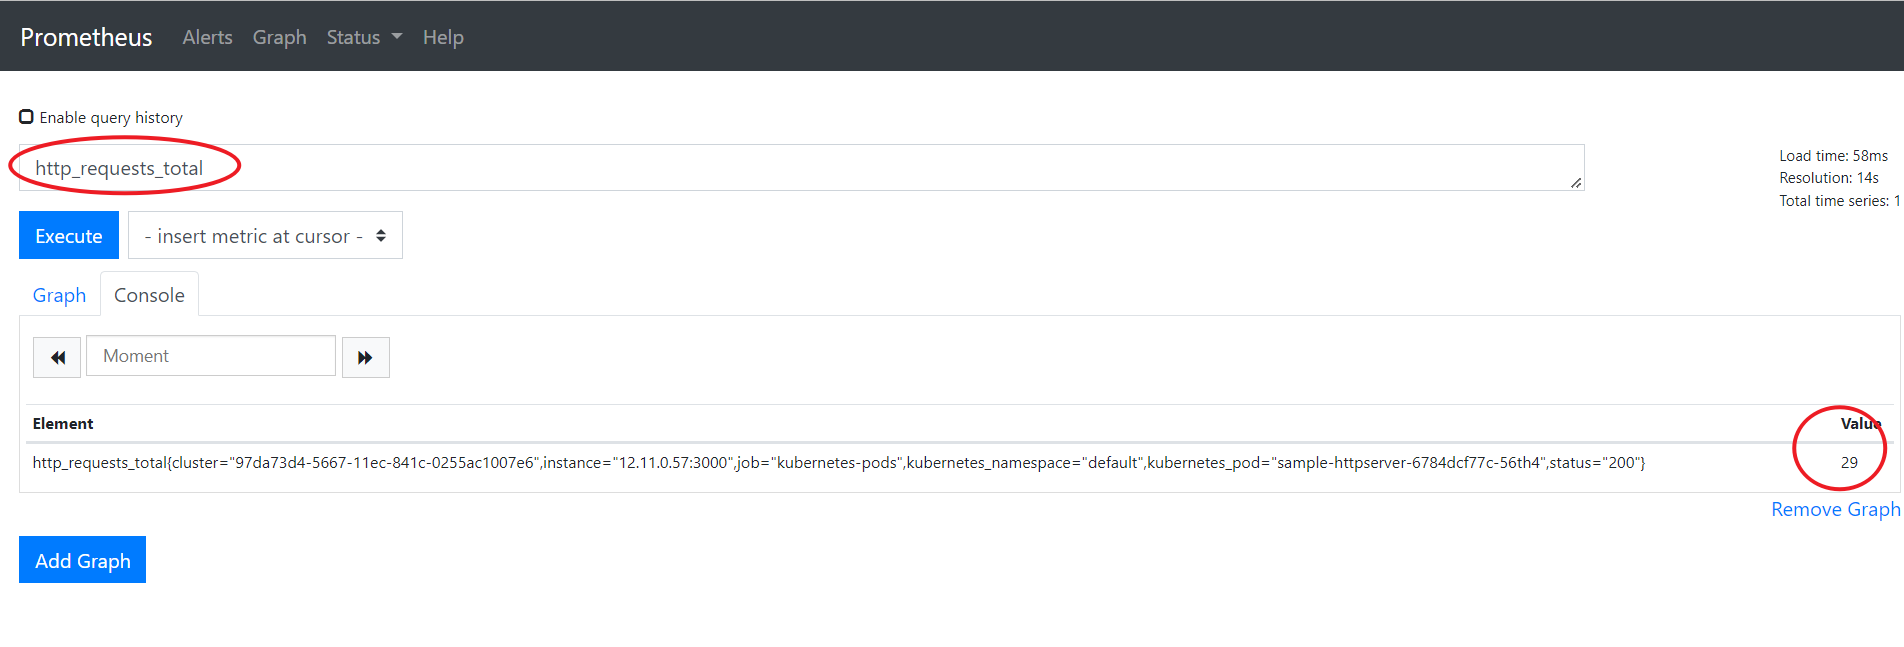
2.2 通过Prometheus查看业务指标
prometheus安装完成后,可修改对应服务为NodePort类型,然后通过访问Node节点的方式访问Prometheus服务。
在prometheus中可见服务指标已经上报,如下图。
也可用PromQL语句聚合查看指标:
2.3 修改Prometheus Adapter自定义HPA指标
Prometheus Adapter的配置文件写在configMap中,查看配置信息并添加自定义指标:
 1
 2
 3
 4
 5
 6
 7
 8
 9
10
11
12
13
14
15
16
17
18
19
20
21
22
23
|
➜  kubectl get cm -nmonitoring
NAME                                                  DATA   AGE
adapter-config                                        1      112m
grafana-conf                                          1      112m
grafana-dashboard-k8s-cluster-rsrc-use                1      112m
grafana-dashboard-k8s-cluster-usage                   1      112m
grafana-dashboard-k8s-node-rsrc-use                   1      112m
grafana-dashboard-k8s-resources-cluster               1      112m
grafana-dashboard-k8s-resources-namespace             1      112m
grafana-dashboard-k8s-resources-pod                   1      112m
grafana-dashboard-k8s-resources-workload              1      112m
grafana-dashboard-k8s-resources-workloads-namespace   1      112m
grafana-dashboard-nodes                               1      112m
grafana-dashboard-persistentvolumesusage              1      112m
grafana-dashboard-pods                                1      112m
grafana-dashboard-statefulset                         1      112m
grafana-dashboards                                    1      112m
grafana-datasources                                   1      112m
prometheus                                            1      112m
prometheus-server-record-rules                        1      112m

➜  kubectl edit cm adapter-config -nmonitoring
configmap/adapter-config edited
|
修改adapter-config,在rule中增加如下内容:
 1
 2
 3
 4
 5
 6
 7
 8
 9
10
11
12
|
    - seriesQuery: '{__name__=~"^http_requests.*_total$",kubernetes_namespace!="",kubernetes_pod!=""}'
      seriesFilters: []
      resources:
        overrides:
          kubernetes_namespace:
            resource: namespace
          kubernetes_pod:
            resource: pod
      name:
        matches: "(.*)_total"
        as: "${1}_qps"
      metricsQuery: sum(rate(<<.Series>>{<<.LabelMatchers>>}[30s])) by (<<.GroupBy>>)
|
修改Adapter配置后需要重启Prometheus Adapter,删除POD后即可重新拉起一个新的POD。
 1
 2
 3
 4
 5
 6
 7
 8
 9
10
11
|
➜  kubectl delete po custom-metrics-apiserver-6ffdb9d866-ht8p2 -nmonitoring

➜  kubectl get po -nmonitoring
NAME                                                      READY   STATUS    RESTARTS   AGE
cceaddon-prometheus-kube-state-metrics-566fd599d5-f258v   1/1     Running   0          6h46m
cceaddon-prometheus-node-exporter-btn4d                   1/1     Running   0          6h46m
cceaddon-prometheus-node-exporter-dq4kb                   1/1     Running   0          6h46m
cceaddon-prometheus-operator-5c8d5fdbb7-7bvp8             1/1     Running   0          6h46m
custom-metrics-apiserver-6ffdb9d866-bgpdm                 1/1     Running   0          32s
grafana-65ccf49786-mqf2f                                  1/1     Running   0          6h46m
prometheus-0                                              2/2     Running   0          6h46m
|
重启后可以获取到自定义指标。
 1
 2
 3
 4
 5
 6
 7
 8
 9
10
11
12
13
14
15
16
17
18
19
20
21
22
|
➜  kubectl get --raw '/apis/custom.metrics.k8s.io/v1beta1/namespaces/default/pods/*/http_requests_qps' |jq .
{
  "kind": "MetricValueList",
  "apiVersion": "custom.metrics.k8s.io/v1beta1",
  "metadata": {
    "selfLink": "/apis/custom.metrics.k8s.io/v1beta1/namespaces/default/pods/%2A/http_requests_qps"
  },
  "items": [
    {
      "describedObject": {
        "kind": "Pod",
        "namespace": "default",
        "name": "sample-httpserver-6784dcf77c-56th4",
        "apiVersion": "/v1"
      },
      "metricName": "http_requests_qps",
      "timestamp": "2022-02-18T09:25:53Z",
      "value": "66m",
      "selector": null
    }
  ]
}
|
注意:这里的 value: 66m,值的后缀“m” 标识 milli-requests per seconds,因此这里的 66m 的意思是 0.1/s 每秒0.066 个请求。
定义HPA策略,sample-httpserver-hpa.yaml:
 1
 2
 3
 4
 5
 6
 7
 8
 9
10
11
12
13
14
15
16
17
18
19
20
21
22
23
24
25
26
27
28
29
30
31
32
|
kind: HorizontalPodAutoscaler
apiVersion: autoscaling/v2beta2
metadata:
  name: sample-httpserver
spec:
  scaleTargetRef:
    apiVersion: apps/v1
    kind: Deployment
    name: sample-httpserver
  minReplicas: 1
  maxReplicas: 10
  behavior:
    scaleDown:
      stabilizationWindowSeconds: 5
      policies:
        - type: Percent
          value: 100
          periodSeconds: 5
    scaleUp:
      stabilizationWindowSeconds: 0
      policies:
        - type: Percent
          value: 100
          periodSeconds: 5
  metrics:
    - type: Pods
      pods:
        metric:
          name: http_requests_qps
        target:
          type: AverageValue
          averageValue: 50000m
|
在这里,定义http_requests_qps的目标值为50000m,表示平均每个POD的RPS为50,假如300的RPS则对应副本数为300/50 = 6.
apply生产HPA对象:
1
2
3
4
5
6
|
➜  kubectl apply -f sample-httpserver-hpa.yaml

➜  kubectl get hpa
NAME                REFERENCE                      TARGETS          MINPODS   MAXPODS   REPLICAS   AGE
hpa-example         Deployment/nginx               1%/49%, 0%/25%   1         100       1          50d
sample-httpserver   Deployment/sample-httpserver   66m/500m         1         10        1          1m
|
2.4 压测触发HPA弹性
这里使用vegeta工具来做压测:
1
2
3
4
|
# 安装vegeta
➜  wget https://github.com/tsenart/vegeta/releases/download/v12.8.4/vegeta_12.8.4_linux_amd64.tar.gz
➜  tar xzvf vegeta_12.8.4_linux_amd64.tar.gz
➜  mv vegeta /usr/local/bin/
|
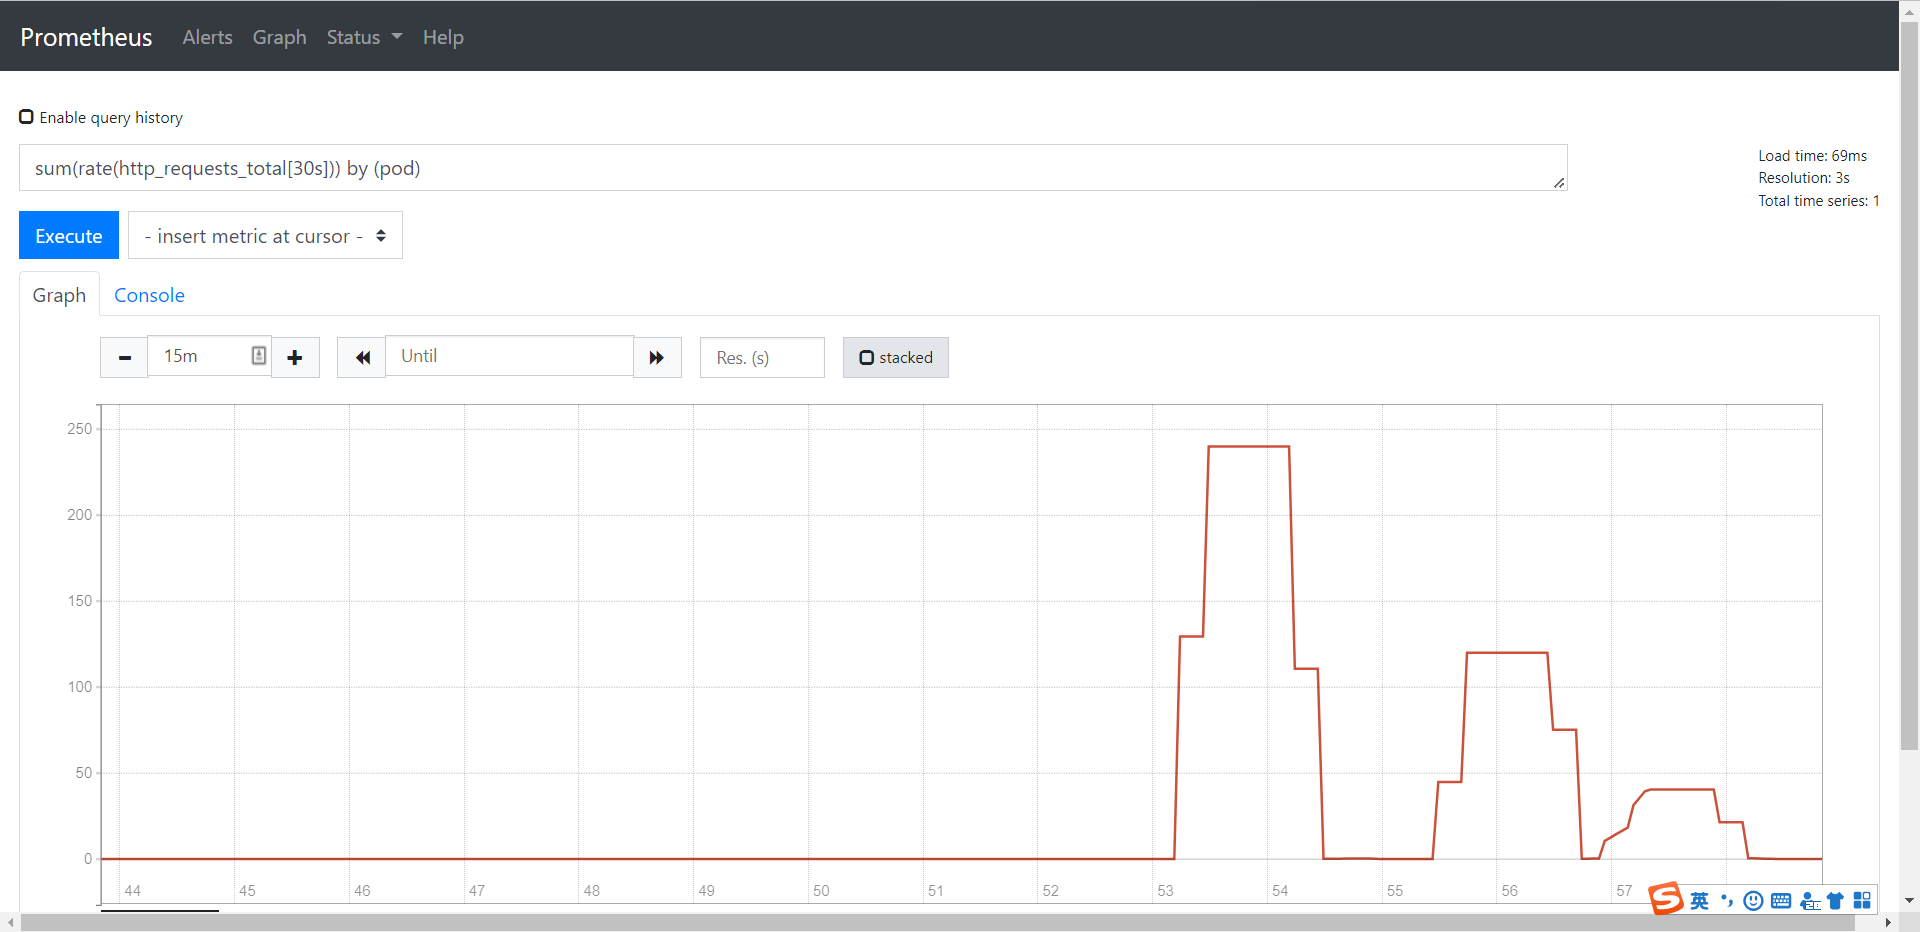
分别使用 240、120、40 的 RPS 发起请求:
1
2
3
4
5
6
|
# 240,将XXX换成svc IP
➜  echo "GET http://xxxx:30826" | vegeta attack -duration 60s -connections 10 -rate 240 | vegeta report
# 120,将XXX换成svc IP
➜  echo "GET http://xxxx:30826" | vegeta attack -duration 60s -connections 10 -rate 120 | vegeta report
# 40,将XXX换成svc IP
➜  echo "GET http://xxxx:30826" | vegeta attack -duration 60s -connections 10 -rate 40 | vegeta report
|
对应在prometheus使用PromQL语句sum(rate(http_requests_total[30s])) by (pod)上可观测到业务指标变化:
OK,正式测试,使用RPS为1000测试1分钟看看。
1
2
3
4
5
6
7
8
9
|
➜  echo "GET http://xxx:30826" | vegeta attack -duration 60s -connections 10 -rate 1000 | vegeta report
Requests      [total, rate, throughput]         60000, 1000.02, 1000.01
Duration      [total, attack, wait]             59.999s, 59.999s, 331.936µs
Latencies     [min, mean, 50, 90, 95, 99, max]  225.81µs, 453.246µs, 381.693µs, 456.696µs, 520.12µs, 2.592ms, 16.406ms
Bytes In      [total, mean]                     720000, 12.00
Bytes Out     [total, mean]                     0, 0.00
Success       [ratio]                           100.00%
Status Codes  [code:count]                      200:60000
Error Set:
|
查看HPA伸缩情况与POD的实际变化情况:
 1
 2
 3
 4
 5
 6
 7
 8
 9
10
11
12
13
14
15
16
17
18
19
20
21
22
23
24
25
26
27
28
29
30
31
32
33
34
35
36
37
38
39
40
41
42
43
44
45
46
47
48
49
50
51
52
53
54
55
56
57
58
59
60
61
62
63
64
65
66
67
68
69
70
71
72
73
74
75
76
77
78
79
80
81
82
83
84
85
86
87
|
➜  kubectl get hpa sample-httpserver -w
NAME                REFERENCE                      TARGETS   MINPODS   MAXPODS   REPLICAS   AGE
sample-httpserver   Deployment/sample-httpserver   66m/50    1         10        1          5h33m
sample-httpserver   Deployment/sample-httpserver   244933m/50   1         10        1          5h36m
sample-httpserver   Deployment/sample-httpserver   1000133m/50   1         10        2          5h36m
sample-httpserver   Deployment/sample-httpserver   694800m/50    1         10        4          5h37m
sample-httpserver   Deployment/sample-httpserver   567033m/50    1         10        8          5h37m
sample-httpserver   Deployment/sample-httpserver   127582m/50    1         10        10         5h37m
sample-httpserver   Deployment/sample-httpserver   66m/50        1         10        10         5h37m
sample-httpserver   Deployment/sample-httpserver   66m/50        1         10        3          5h38m
sample-httpserver   Deployment/sample-httpserver   66m/50        1         10        1          5h38m

➜  kubectl get po -l app=sample-httpserver -w
NAME                                 READY   STATUS    RESTARTS   AGE
sample-httpserver-6784dcf77c-56th4   1/1     Running   0          5h57m
sample-httpserver-6784dcf77c-df4cd   0/1     Pending   0          0s
sample-httpserver-6784dcf77c-df4cd   0/1     Pending   0          0s
sample-httpserver-6784dcf77c-df4cd   0/1     ContainerCreating   0          0s
sample-httpserver-6784dcf77c-df4cd   0/1     ContainerCreating   0          1s
sample-httpserver-6784dcf77c-df4cd   1/1     Running             0          2s
sample-httpserver-6784dcf77c-g8bhk   0/1     Pending             0          0s
sample-httpserver-6784dcf77c-g8bhk   0/1     Pending             0          0s
sample-httpserver-6784dcf77c-w9blj   0/1     Pending             0          0s
sample-httpserver-6784dcf77c-w9blj   0/1     Pending             0          0s
sample-httpserver-6784dcf77c-g8bhk   0/1     ContainerCreating   0          0s
sample-httpserver-6784dcf77c-w9blj   0/1     ContainerCreating   0          0s
sample-httpserver-6784dcf77c-w9blj   0/1     ContainerCreating   0          2s
sample-httpserver-6784dcf77c-w9blj   1/1     Running             0          2s
sample-httpserver-6784dcf77c-g8bhk   0/1     ContainerCreating   0          2s
sample-httpserver-6784dcf77c-g8bhk   0/1     ContainerCreating   0          3s
sample-httpserver-6784dcf77c-g8bhk   1/1     Running             0          3s
sample-httpserver-6784dcf77c-2hrdp   0/1     Pending             0          0s
sample-httpserver-6784dcf77c-2hrdp   0/1     Pending             0          0s
sample-httpserver-6784dcf77c-pmr6f   0/1     Pending             0          0s
sample-httpserver-6784dcf77c-6rklq   0/1     Pending             0          0s
sample-httpserver-6784dcf77c-pmr6f   0/1     Pending             0          0s
sample-httpserver-6784dcf77c-6rklq   0/1     Pending             0          0s
sample-httpserver-6784dcf77c-2hrdp   0/1     ContainerCreating   0          0s
sample-httpserver-6784dcf77c-pmr6f   0/1     ContainerCreating   0          0s
sample-httpserver-6784dcf77c-6rklq   0/1     ContainerCreating   0          0s
sample-httpserver-6784dcf77c-h5wpj   0/1     Pending             0          0s
sample-httpserver-6784dcf77c-h5wpj   0/1     Pending             0          0s
sample-httpserver-6784dcf77c-h5wpj   0/1     ContainerCreating   0          0s
sample-httpserver-6784dcf77c-2hrdp   0/1     ContainerCreating   0          2s
sample-httpserver-6784dcf77c-6rklq   0/1     ContainerCreating   0          2s
sample-httpserver-6784dcf77c-2hrdp   1/1     Running             0          3s
sample-httpserver-6784dcf77c-pmr6f   0/1     ContainerCreating   0          3s
sample-httpserver-6784dcf77c-h5wpj   0/1     ContainerCreating   0          3s
sample-httpserver-6784dcf77c-pmr6f   1/1     Running             0          4s
sample-httpserver-6784dcf77c-6rklq   1/1     Running             0          4s
sample-httpserver-6784dcf77c-h5wpj   1/1     Running             0          4s
sample-httpserver-6784dcf77c-zb2sx   0/1     Pending             0          0s
sample-httpserver-6784dcf77c-zb2sx   0/1     Pending             0          0s
sample-httpserver-6784dcf77c-gkh2f   0/1     Pending             0          0s
sample-httpserver-6784dcf77c-gkh2f   0/1     Pending             0          0s
sample-httpserver-6784dcf77c-pmr6f   1/1     Terminating         0          45s
sample-httpserver-6784dcf77c-h5wpj   1/1     Terminating         0          45s
sample-httpserver-6784dcf77c-gkh2f   0/1     Terminating         0          30s
sample-httpserver-6784dcf77c-g8bhk   1/1     Terminating         0          60s
sample-httpserver-6784dcf77c-2hrdp   1/1     Terminating         0          45s
sample-httpserver-6784dcf77c-zb2sx   0/1     Terminating         0          30s
sample-httpserver-6784dcf77c-6rklq   1/1     Terminating         0          45s
sample-httpserver-6784dcf77c-zb2sx   0/1     Terminating         0          30s
sample-httpserver-6784dcf77c-gkh2f   0/1     Terminating         0          30s
sample-httpserver-6784dcf77c-pmr6f   0/1     Terminating         0          46s
sample-httpserver-6784dcf77c-pmr6f   0/1     Terminating         0          47s
sample-httpserver-6784dcf77c-pmr6f   0/1     Terminating         0          47s
sample-httpserver-6784dcf77c-2hrdp   0/1     Terminating         0          47s
sample-httpserver-6784dcf77c-6rklq   0/1     Terminating         0          47s
sample-httpserver-6784dcf77c-h5wpj   0/1     Terminating         0          47s
sample-httpserver-6784dcf77c-g8bhk   0/1     Terminating         0          62s
sample-httpserver-6784dcf77c-2hrdp   0/1     Terminating         0          58s
sample-httpserver-6784dcf77c-2hrdp   0/1     Terminating         0          58s
sample-httpserver-6784dcf77c-6rklq   0/1     Terminating         0          58s
sample-httpserver-6784dcf77c-6rklq   0/1     Terminating         0          58s
sample-httpserver-6784dcf77c-h5wpj   0/1     Terminating         0          58s
sample-httpserver-6784dcf77c-h5wpj   0/1     Terminating         0          58s
sample-httpserver-6784dcf77c-g8bhk   0/1     Terminating         0          73s
sample-httpserver-6784dcf77c-g8bhk   0/1     Terminating         0          73s
sample-httpserver-6784dcf77c-df4cd   1/1     Terminating         0          90s
sample-httpserver-6784dcf77c-w9blj   1/1     Terminating         0          75s
sample-httpserver-6784dcf77c-w9blj   0/1     Terminating         0          76s
sample-httpserver-6784dcf77c-df4cd   0/1     Terminating         0          91s
sample-httpserver-6784dcf77c-df4cd   0/1     Terminating         0          92s
sample-httpserver-6784dcf77c-df4cd   0/1     Terminating         0          92s
sample-httpserver-6784dcf77c-w9blj   0/1     Terminating         0          77s
sample-httpserver-6784dcf77c-w9blj   0/1     Terminating         0          77s
|
参考文章:
https://www.shangmayuan.com/a/da1fc7f47f684c71938fd3f2.html
https://www.qikqiak.com/k8strain/monitor/adapter/#_3
全文完。